
HR metrics are numbers that show how well a company hires, keeps, pays, develops and schedules its people. Most lists stop at the formula. This guide runs all 16 formulas through the same illustrative company of 120 people, so you can see what each input means, where it comes from and what changes when one input moves.
You will also find sourced benchmarks with the country and period they describe, the data each metric is built from, and the mistakes that make HR numbers look better or worse than they are.
- What are HR metrics?
- HR metrics formulas at a glance
- The employee data HR metrics are built from
- The example company
- Workforce and retention metrics
- Recruitment metrics
- Absence, leave and overtime metrics
- Productivity and cost metrics
- Engagement and development metrics
- HR metrics benchmarks
- Which HR metrics to track first
- Common mistakes with HR metrics
- Tracking leave and availability metrics in actiPLANS
- FAQ
What are HR metrics?
HR metrics are repeatable calculations on workforce data, such as the number of people who left in a year divided by the average number on staff. Because the inputs and the period stay the same each time, you can compare the result month to month, team to team and against outside benchmarks.
An HR KPI is a metric you have tied to a target. Turnover rate is a metric. “Bring voluntary turnover below 10% this year” is a KPI. You can track as many metrics as you need to diagnose problems, but leadership will only follow a handful, so promote three to five of them to KPIs.
The types of HR metrics are easier to pick from once you sort them by the question they answer. Efficiency metrics such as cost per hire, time to fill and training cost per employee tell you what an HR process costs. Effectiveness metrics such as retention rate, quality of hire and early turnover tell you whether that process worked. Impact metrics such as revenue per employee, human capital ROI and absence cost connect people decisions to money.
Metrics answer “what happened”. Explaining why it happened and predicting what comes next is the job of people analytics, which builds on the metrics below.
HR metrics formulas at a glance
The table lists all 16 formulas with the result each gives for the example company used throughout this guide. Every one is worked through step by step further down.
| HR metric | Formula | Example result |
|---|---|---|
| 1. FTE | Total contracted weekly hours ÷ standard full time weekly hours | 114 FTE from 120 people |
| 2. Turnover rate | Leavers ÷ average headcount × 100 | 15.0% |
| 3. Retention rate | Starting employees still employed at the end ÷ starting headcount × 100 | 88.1% |
| 4. Early turnover | Hires who left within 12 months ÷ hires in the cohort × 100 | 18.2% |
| 5. Time to fill and time to hire | Offer acceptance date − requisition approval date (or − application date) | 41 and 32 days |
| 6. Cost per hire | (Internal + external recruiting costs) ÷ hires | $4,655 |
| 7. Offer acceptance rate | Offers accepted ÷ offers made × 100 | 84.6% |
| 8. Quality of hire | Weighted score of performance, cohort retention and manager satisfaction | 77.9 out of 100 |
| 9. Absenteeism rate | Unplanned absence days ÷ scheduled working days × 100 | 2.1% |
| 10. PTO utilization | Vacation days taken ÷ vacation days granted × 100 | 75.0% |
| 11. Overtime rate | Overtime hours ÷ regular hours × 100 | 1.7%, costing $184,500 |
| 12. Absence cost | Unplanned absence days × average daily pay | $141,120 |
| 13. Revenue per employee | Annual revenue ÷ average headcount (or FTE) | $120,000 |
| 14. Human capital ROI | (Revenue − (operating expenses − employee costs)) ÷ employee costs | 1.21 |
| 15. eNPS | % promoters − % detractors | +16 |
| 16. Training cost and hours per employee | Training spend (or hours) ÷ headcount | $480 and 20 hours |
The employee data HR metrics are built from
Employee data is the information a company collects about its people during employment, from names and hire dates to absence records, pay and performance results. Every HR metric is a calculation on one or more of these records, so a metric can only be as good as the record underneath it.
| Type of employee data | Typical source | Metrics it feeds |
|---|---|---|
| Employment records: hire date, termination date and reason, contract hours | HRIS, offer letters, termination letters | Headcount, FTE, turnover, retention, early turnover, tenure |
| Recruiting records: requisition date, application date, offers, costs | Applicant tracking system, finance | Time to fill, time to hire, cost per hire, offer acceptance |
| Attendance and time off records: leave taken by type, balances, unplanned absence | Leave management and time tracking software | Absenteeism rate, PTO utilization, absence cost, overtime rate |
| Pay and cost records: salaries, benefits, overtime pay, training spend | Payroll, finance | Overtime expense, human capital ROI, training cost per employee |
| Performance, skills and survey data: ratings, qualifications, courses, eNPS answers | Performance reviews, learning system, surveys | Quality of hire, eNPS, training hours, performance and potential |
| Demographic data: age, gender, education, location | Employee self service portal, onboarding forms | Diversity ratios, any metric broken down by group |
Demographic data shows who makes up the workforce and whether hiring keeps drawing from the same narrow group. Qualification data shows skill gaps and candidates for internal moves before you post a job outside. Attendance and time off records show lateness patterns, frequent short absences and upcoming vacations that will leave a team short. Employment length shows whether people leave in the first year, which points to hiring or onboarding problems. Performance data supports appraisals, promotions and improvement plans.
Collection is mostly routine. New hires enter personal details through a self service portal or an onboarding survey. Time off comes from leave requests. Exit reasons come from a short survey of people who resign, collected before their last day.
Rules for handling employee data
- Keep one record per person. When the HRIS says 122 people and payroll says 125, every metric built on headcount is wrong in two different ways.
- Write down your definitions. Decide whether headcount includes contractors, whether FTE is based on 37.5 or 40 hours, and which date ends a vacancy. Change a definition and you break the trend line.
- Know how long you must keep records. In the US, 29 CFR 1602.14 requires employers to keep personnel records for one year from the record or personnel action, and 29 CFR Part 516 requires payroll records for three years and time cards for two. In the UK and EU, Article 5 of the GDPR requires that personal data is limited to what is necessary and kept no longer than needed.
- Report at team level. Individual metrics belong in the same confidential file as pay and reviews. Published dashboards should show groups large enough that no one can be singled out.
- Use the data to fix problems. Once people believe a number is used against them, they learn to game it, and the number stops telling you anything.
The example company
Every worked example below uses the same company over one calendar year. The figures are illustrative and chosen to be internally consistent, so a reader can check each calculation against the others.
| Input | Value | Used in |
|---|---|---|
| People on staff at the start and end of the year | 118 and 122 (average 120) | Turnover, retention, per employee metrics |
| Working pattern | 108 full time at 40 hours, 12 part time at 20 hours | FTE, overtime rate |
| Hires and leavers | 22 hires, 18 leavers (12 voluntary) | Turnover, early turnover, cost per hire |
| Average salary | $62,400 ($30 an hour, $240 a day) | Overtime expense, absence cost, PTO liability |
| Working days per person | 250 after public holidays | Absenteeism rate |
| Revenue, operating expenses, total employee costs | $14.4M, $12.6M, $8.4M | Revenue per employee, human capital ROI |
Workforce and retention metrics
1. Headcount and FTE
Headcount is the number of people employed. FTE (full time equivalent) converts part time hours into full time positions, which is the right denominator for cost and output metrics.
Formula: FTE = total contracted hours per week ÷ standard full time hours per week
Worked example: (108 × 40 + 12 × 20) ÷ 40 = (4,320 + 240) ÷ 40 = 114 FTE. The company has 120 people but 114 FTE. Divide revenue by the wrong one and the result moves by about 5%.
2. Turnover rate
Turnover rate is the share of the average workforce that left during a period, for any reason. The full method, including monthly and annual versions, is in our guide to employee turnover.
Formula: turnover rate = leavers in the period ÷ average headcount × 100
Worked example: 18 ÷ 120 × 100 = 15.0%. Voluntary turnover counts only resignations: 12 ÷ 120 × 100 = 10.0%. If two more people resign, total turnover rises to 16.7%.
Attrition is related but different: it counts departures whose roles are not refilled. It has its own attrition rate formula.
3. Retention rate
Retention rate is the share of people on staff at the start of a period who are still there at the end. It ignores everyone hired during the period.
Formula: retention rate = people from the starting headcount still employed at the end ÷ starting headcount × 100
Worked example: 14 of the 18 leavers were on staff at the start of the year, and 4 were hired during it. (118 − 14) ÷ 118 × 100 = 88.1%. That is not 100% minus the 15.0% turnover rate, because turnover also counts the 4 new hires who left. Calculate both separately.
4. Early turnover
Early turnover, or new hire turnover, is the share of hires who leave within their first year. It is one of the clearest signals of a hiring or onboarding problem.
Formula: early turnover = hires who left within 12 months ÷ total hires in the cohort × 100
Worked example: 4 ÷ 22 × 100 = 18.2%. Company turnover is 15.0%, so new hires leave faster than everyone else. Hires made late in the year have not had 12 months to leave, so recalculate the cohort once it is a full year old.
Recruitment metrics
5. Time to fill and time to hire
Time to fill measures how long a role stays open, from requisition approval to an accepted offer. Time to hire measures how quickly you move a candidate, from their application to the accepted offer. Use the first for workforce planning and the second for candidate experience.
Formula: time to fill = offer acceptance date − requisition approval date; time to hire = offer acceptance date − application date
Worked example: A support role is approved on day 0, posted on day 2, and the eventual hire applies on day 9 and accepts on day 41. Time to fill is 41 days. Time to hire is 41 − 9 = 32 days. The 9 days before the application belong to sourcing, not to your interview process.
6. Cost per hire
Cost per hire is total recruiting spend divided by the number of hires in the same period.
Formula: cost per hire = (internal recruiting costs + external recruiting costs) ÷ number of hires
Worked example: internal costs (the share of recruiter and hiring manager time spent on hiring) are $38,000. External costs are $45,000 in agency fees, $12,400 for job boards, $2,200 for background checks and $4,800 for candidate travel, so $64,400. ($38,000 + $64,400) ÷ 22 = $4,655 per hire. If one $15,000 agency placement is replaced by a referral, cost per hire falls to $3,973.
7. Offer acceptance rate
Formula: offer acceptance rate = offers accepted ÷ offers made × 100
Worked example: 22 ÷ 26 × 100 = 84.6%. Four declined offers usually mean four searches that restarted, so a falling rate shows up later as longer time to fill.
8. Quality of hire
Quality of hire has no single standard formula. Most companies build a weighted score from three inputs they already collect.
Formula: quality of hire = (first year performance score × 0.4) + (12 month retention of the cohort × 0.4) + (hiring manager satisfaction × 0.2), each on a 0 to 100 scale
Worked example: average first year rating 78, cohort retention 18 ÷ 22 = 81.8, manager satisfaction 70. (78 × 0.4) + (81.8 × 0.4) + (70 × 0.2) = 31.2 + 32.7 + 14.0 = 77.9. Keep the weights fixed from year to year or the score cannot be compared.
Absence, leave and overtime metrics
9. Absenteeism rate
Absenteeism rate is the share of scheduled working time lost to unplanned absence. Approved vacation is planned time off, so it is removed from the denominator and never counted as absence. How to bring the number down is covered in our guide to absenteeism in the workplace.
Formula: absenteeism rate = unplanned absence days ÷ scheduled working days × 100
Worked example: 120 people × 250 working days = 30,000 days. Minus 1,980 days of approved vacation leaves 28,020 scheduled days. Unplanned absence was 588 days. 588 ÷ 28,020 × 100 = 2.1%. Count the vacation as absence and the rate jumps to 8.6%, a common way this metric gets misreported. To see whether absence comes in a few long spells or many short ones, add the Bradford Factor.
10. PTO utilization
PTO utilization shows how much granted vacation people actually take. Low utilization looks cheap, but it can mean unused balances building into a liability, or people who feel they cannot get away from work.
Formula: PTO utilization = vacation days taken ÷ vacation days granted × 100
Worked example: the company grants an average of 22 days, so 2,640 days in total. Employees took 1,980. 1,980 ÷ 2,640 × 100 = 75.0%, leaving 660 days unused. At $240 a day, that is $158,400 of balances, which becomes a cost if your policy carries days over or pays them out. More on that in our article on unused vacation days.
The baseline differs by country. The US Fair Labor Standards Act does not require paid vacation, so the days granted are a company policy. In the UK, most workers on a five day week are entitled to 28 days of paid leave a year, and employers may count bank holidays in that total. Compare utilization only between groups with the same entitlement.
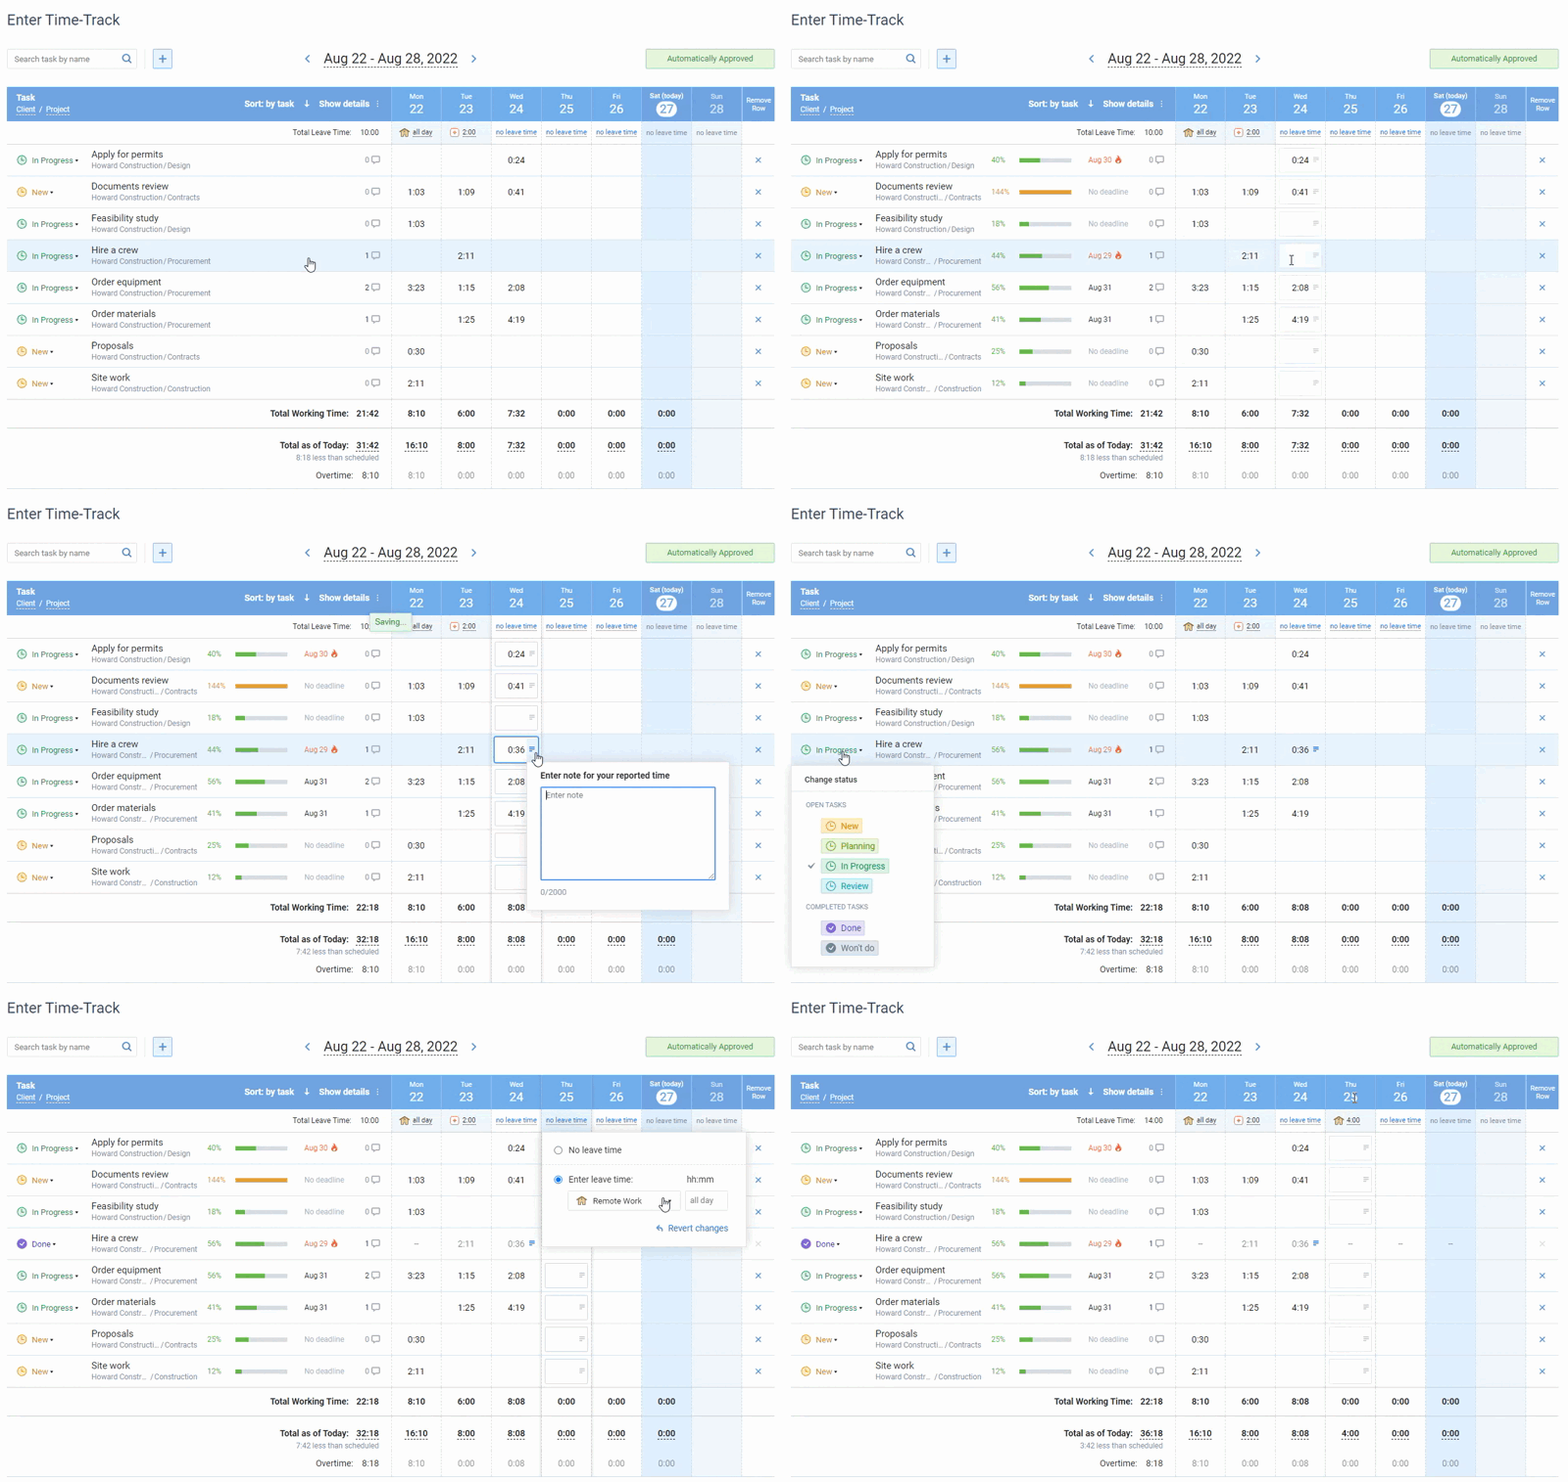
11. Overtime rate and overtime expense
Overtime rate shows how much of the work is done beyond contracted hours. Read it next to absence and resignations for the same team. When all three rise together, workload is the first thing to check.
Formula: overtime rate = overtime hours ÷ regular hours × 100; overtime expense = overtime hours × hourly rate × overtime multiplier
Worked example: regular hours are 114 FTE × 2,080 = 237,120. Overtime hours were 4,100. 4,100 ÷ 237,120 × 100 = 1.7%. Under the US Fair Labor Standards Act, covered employees earn at least time and a half for hours over 40 in a workweek, so the expense is 4,100 × $30 × 1.5 = $184,500. Other countries set their own multipliers and thresholds, so swap in your local rule.
12. Absence cost
Absence cost puts a price on unplanned absence. The simple version counts only the wages paid for days not worked.
Formula: absence cost = unplanned absence days × average daily pay
Worked example: 588 × $240 = $141,120. This is a floor. It leaves out overtime paid to cover shifts, temporary staff and slower output, so state that in any report that uses it. People who come in sick and work at half speed do not appear here at all; that cost is covered in our article on presenteeism and absenteeism.
Productivity and cost metrics
13. Revenue per employee
Formula: revenue per employee = annual revenue ÷ average headcount (or ÷ FTE)
Worked example: $14,400,000 ÷ 120 = $120,000 per employee, or $14,400,000 ÷ 114 = $126,316 per FTE. Pick one version and keep it. Revenue per employee is most useful as your own trend over several years, because it varies widely between industries.
14. Human capital ROI
Human capital ROI estimates how much revenue each dollar spent on people returns after other operating costs.
Formula: human capital ROI = (revenue − (operating expenses − total employee costs)) ÷ total employee costs
Worked example: ($14.4M − ($12.6M − $8.4M)) ÷ $8.4M = $10.2M ÷ $8.4M = 1.21. Each dollar of pay and benefits is matched by $1.21 of revenue once other operating costs are paid. Below 1, people cost more than the business earns after its other costs. The direction from year to year tells you more than any single result.
For individual performance, many teams add a nine box grid that places each person by performance and potential. Its useful number is the distribution: if 9 of 120 people sit in the top box, 7.5% of the workforce is your realistic succession pool.

Engagement and development metrics
15. Employee Net Promoter Score (eNPS)
eNPS asks one question: “How likely are you to recommend this company as a place to work?” on a scale from 0 to 10. Scores of 9 and 10 are promoters, 7 and 8 are passives, 0 to 6 are detractors.
Formula: eNPS = % promoters − % detractors
Worked example: 100 of 120 people answered. 38 were promoters, 40 passives and 22 detractors. 38% − 22% = +16. With 100 answers, a swing of three or four points between surveys can be noise. For broader measurement, see our guides on employee satisfaction and employee engagement.
16. Training cost and training hours per employee
Formula: training cost per employee = total training spend ÷ headcount; training hours per employee = total training hours ÷ headcount
Worked example: $57,600 ÷ 120 = $480 per employee, and 2,400 hours ÷ 120 = 20 hours per employee. Neither number says whether the training worked. Pair them with completion rates and with the performance or retention of people who took the course. Tools for this are compared in our roundup of training tracking software.
HR metrics benchmarks
A benchmark is only useful if it measures the same thing as your number. Each figure below is labelled with its country, period and exact measure.
| Metric | Benchmark | Source and scope |
|---|---|---|
| Total separations (turnover) | 3.3% a month on average in 2024 and 2025, or 62.8 million separations in 2025 | US, all nonfarm employers. BLS JOLTS rates and levels |
| Quits (voluntary turnover) | 2.0% a month on average in 2025 (2.1% in 2024) | US, all nonfarm employers. BLS JOLTS |
| Absence | 1.7% of usual hours lost; 3.2% of workers absent in a given week | US, full time wage and salary workers, 2025 annual average built from 11 months of survey data; vacation excluded. BLS CPS Table 47 |
| Sickness absence | 2.6% of working hours; 5.7 days per worker | UK, 2022. ONS |
| Cost per hire | Nearly $4,700 | US, SHRM benchmarking data published in 2022. SHRM |
| Engagement | 31% engaged in the US (2024); 20% engaged globally (2025) | Gallup surveys; US sample of 79,087 workers. Gallup US, Gallup global |
Three cautions apply. JOLTS rates are monthly, so 3.3% a month adds up to roughly 40% over a year across the whole US economy, which mixes seasonal, temporary and permanent jobs. The US absence rate counts workers with any absence in the survey week, while the lost worktime rate is the one that matches the absenteeism formula above. Gallup’s engagement figure comes from its own survey items, so it cannot be compared directly with an eNPS score.
Which HR metrics to track first
Start from the question your leadership asks, then pick the two or three metrics that answer it.
- Under 50 people: turnover, absenteeism rate, PTO utilization and overtime rate. Report them quarterly, because monthly numbers at this size swing on one resignation.
- Hiring fast: time to fill, offer acceptance rate, cost per hire and early turnover. Early turnover tells you whether speed is costing you quality.
- People are leaving: voluntary turnover by team and manager, retention rate, eNPS and time since last promotion.
- Burnout or coverage problems: overtime rate, absenteeism rate and PTO utilization by team. High overtime with low vacation use in the same team is the pattern to act on.
- Leadership wants financial proof: revenue per FTE, human capital ROI and absence cost.
Assign each metric an owner, a definition and a reporting cadence before you build a dashboard. Recruiting metrics are usually reviewed monthly, turnover and absence quarterly, and financial ratios once a year.
Common mistakes with HR metrics
- Counting approved leave as absence. In the example, this turns a 2.1% absenteeism rate into 8.6%.
- Mixing headcount and FTE. Revenue per employee is $120,000 by headcount and $126,316 by FTE. Both are correct, but switching between them produces a trend that never happened.
- Changing the denominator. Turnover on starting headcount (18 ÷ 118 = 15.3%) and on average headcount (15.0%) give different answers. Pick one and write it down.
- Treating retention as 100% minus turnover. The example shows 88.1% retention against 15.0% turnover, not 85%.
- Reading small teams as trends. One resignation in a team of 8 is 12.5% turnover. Use rolling 12 month figures for small groups.
- Tying a metric to one person’s bonus. People then work on the number instead of the job. Report at team level and keep individual numbers confidential.
- Building dashboards nobody acts on. If a metric has not changed a decision in a year, drop it.
Tracking leave and availability metrics in actiPLANS
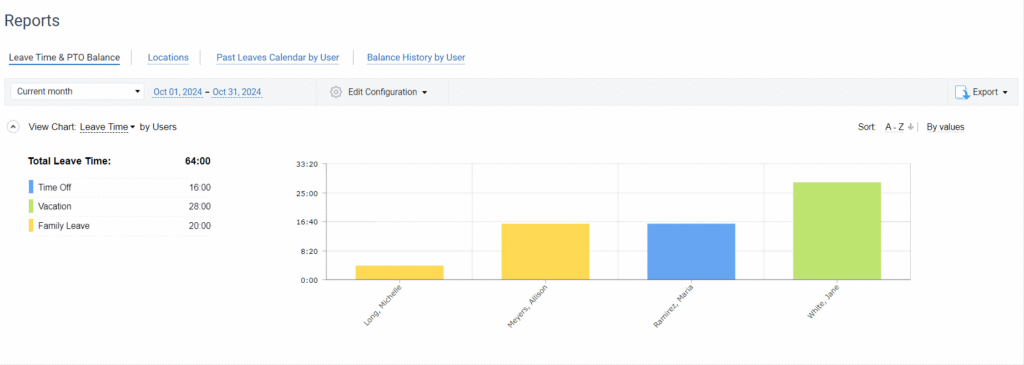
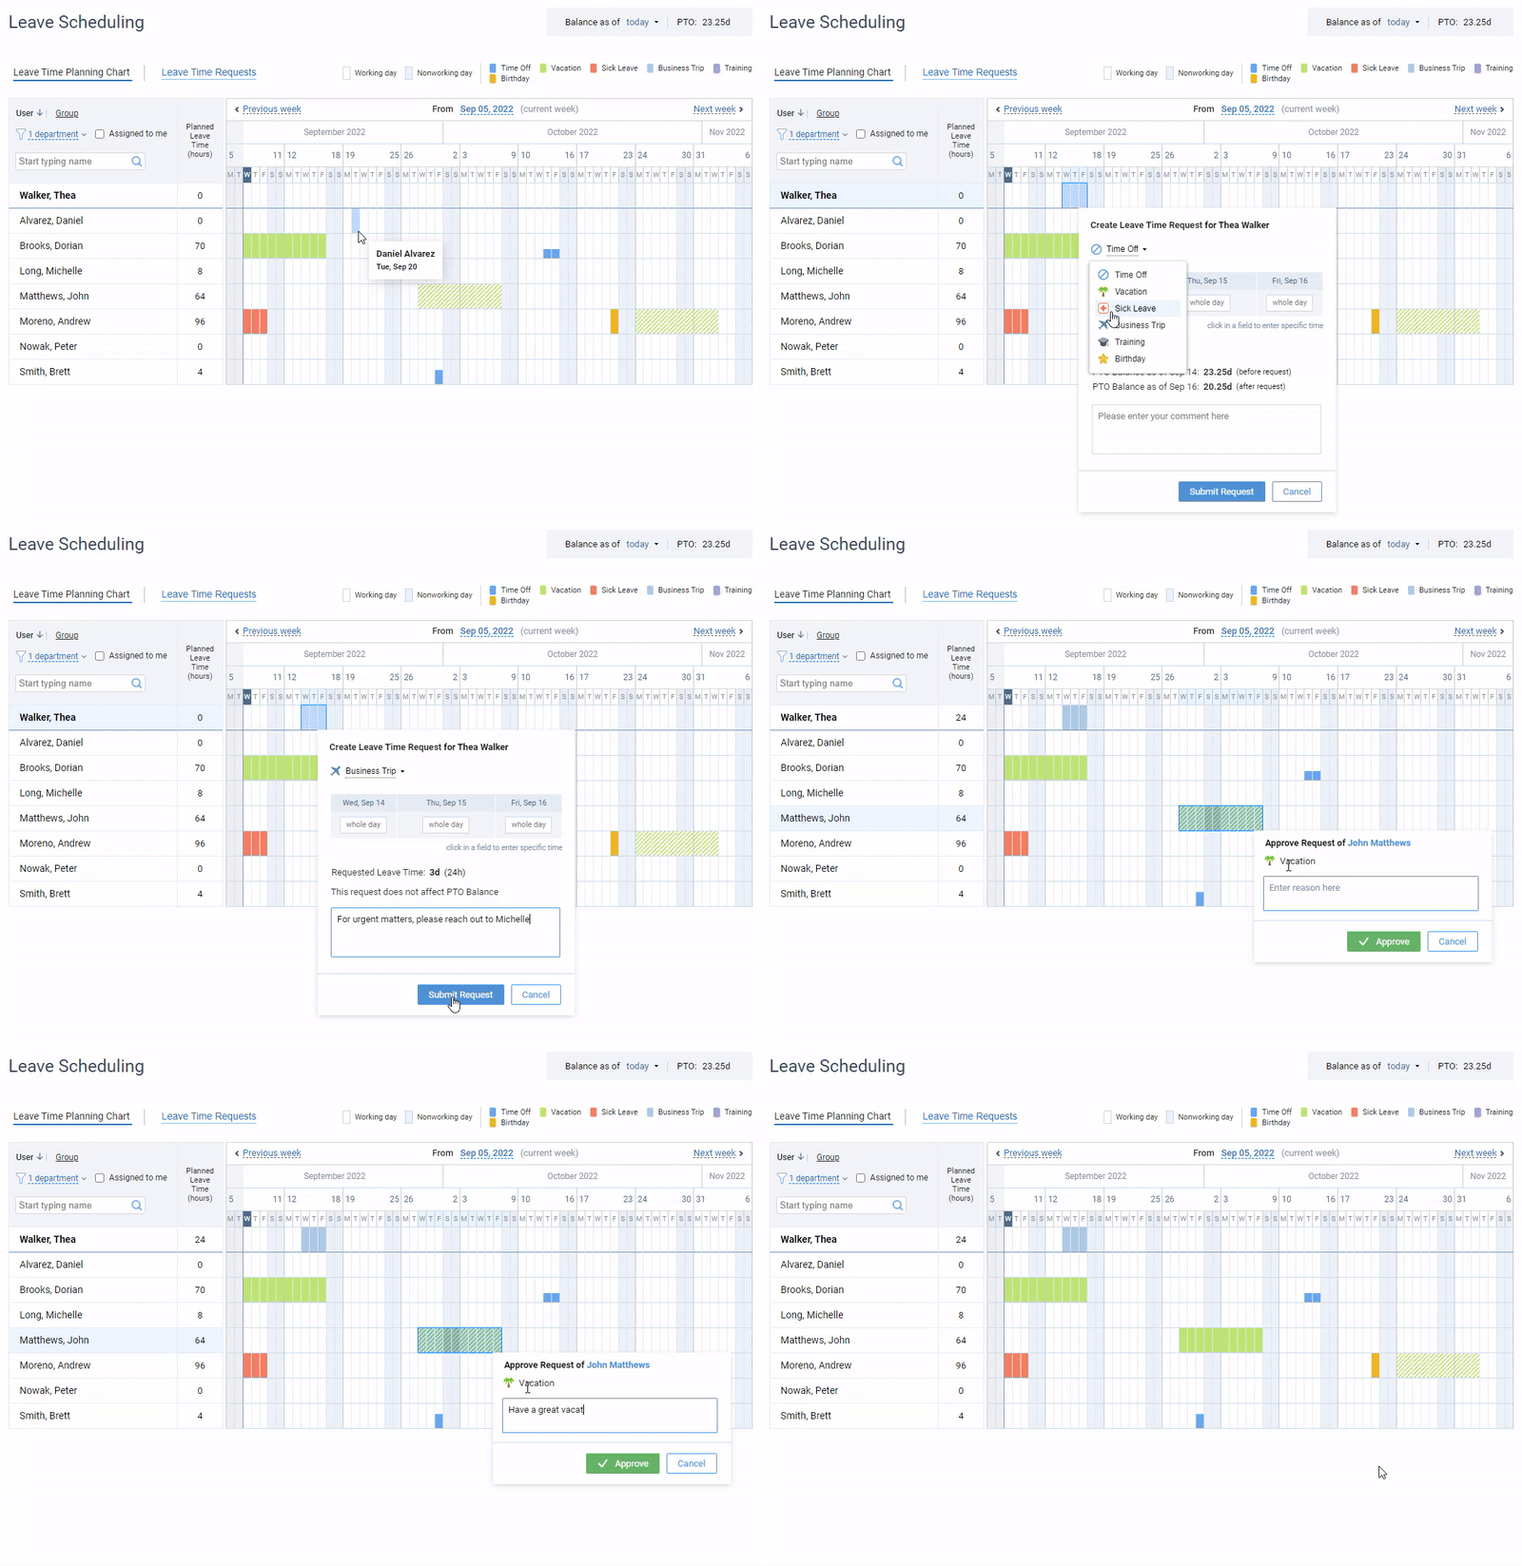
Four of the 16 metrics depend on leave and absence records: absenteeism rate, PTO utilization, absence cost and the Bradford Factor. In many companies that data sits in spreadsheets and email threads, which makes it the hardest to trust. actiPLANS records it at the source, because employees request leave in the app and managers approve it there.
- The Leave time and balances report shows leave taken and remaining balances by employee and leave type, which are the inputs for PTO utilization and unused balance liability.
- The Past leaves report keeps a history of leave actually taken, for absenteeism rate and absence cost over any period.
- The Balance history report logs every change to a balance, including accruals and manual adjustments, which helps when someone disputes a number.
- The Location report shows where people worked, such as the office, home or a client site.
- Every report can be filtered by team, location, role and leave type and exported to CSV or PDF for your metric spreadsheet or payroll.
Unlimited custom leave types let you separate sick leave from vacation and from training days, so each metric counts only the leave it should. Balances follow your accrual rules automatically and update when leave is taken. For overtime hours, connect actiPLANS with actiTIME, which tracks working time. actiPLANS does not calculate turnover, cost per hire or eNPS; those come from your HRIS, applicant tracking system and surveys. See how other teams use the reports in this actiPLANS reports walkthrough.
Start a free 30 day trial of actiPLANS to see your own leave data in these reports, or request a demo.
FAQ
What are the 5 key HR metrics?
For most companies, the five to start with are voluntary turnover rate, retention rate, time to fill, absenteeism rate and cost per hire. Together they cover whether people stay, how quickly you replace them, what hiring costs and how much scheduled time is lost. Add PTO utilization and overtime rate if burnout is a concern.
How often should HR metrics be reported?
Monthly for recruiting metrics such as time to fill, quarterly for turnover, absence and eNPS, and annually for revenue per employee and human capital ROI. Teams under about 50 people should use quarterly or rolling 12 month figures, because a single event moves monthly numbers too much to read.
What is the difference between HR metrics and HR analytics?
HR metrics describe what happened, such as a 15% turnover rate. HR analytics, also called people analytics, explains why it happened and what is likely next, for example by linking turnover to manager, tenure or overtime. You need consistent metrics before analytics can work.


